- Analysis
- Data
- CORSIKA
- Signal
- Level 2
- Trigger (level 0)
- Pole filter (level 1)
- Level 2
- Level 3
- Cut variables
- Reconstructions
- Development of cuts
- Level 4
- Cut variables
- Reconstructions
- Development of cuts
- Level 5
- Cut variables
- Development of cuts
- Level 6
- Cut variables
- Development of cuts
- Final
- Sensitivity
- Remaining events
- Resolutions
- Data/Monte Carlo Comparison
- Excess in COG
- Level 5 TMVA
- Summary Of Issues
- Feature extractor
- Hit binning bug
- Good DOM list
- DOMcalibrator
- Systematics
- Ice properties
- DOM efficiency
- Cross-section
- Seasonal variation
- Unblinding Discussion
- Diffuse call
- Analysis call
- Results
- Plots
- Events
 |
 |
 |
 |
 |
 |
 |
 |
 |
| . | Number of Events |
| Experimental data | 6.3666 × 10-7Hz × (8093.71hours × 60minutes × 60seconds) = 18.5505 events |
| Single CORSIKA | 0 |
| Double CORSIKA | 0 |
| Triple CORSIKA | 0 |
| Weighted single CORSIKA | 0 |
| Weighted double CORSIKA | 0 |
| Proton two-component CORSIKA | 0 |
| Iron two-component CORSIKA | 0 |
| E-2 &nue signal (3.6 × 10⁻⁷) | 2.80514 × 10-6Hz × (8093.71hours × 60minutes × 60seconds) = 81.1734 events |
| E-2 &nu&mu signal (3.6 × 10⁻⁷) | 9.76639 × 10-7Hz × (8093.71hours × 60minutes × 60seconds) = 28.4567 events |
| E-2 &nu&tau signal (3.6 × 10⁻⁷) | 2.65159 × 10-6Hz × (8093.71hours × 60minutes × 60seconds) = 77.2603 events |
| Atmospheric &nue signal (conv. + prompt) | 7.83573 × 10-8Hz × (8093.71hours × 60minutes × 60seconds) = 2.2831 events |
| Atmospheric &nu&mu signal (conv. + prompt) | 5.59485 × 10-8Hz × (8093.71hours × 60minutes × 60seconds) = 1.6302 events |
| Model | Number of &nue Events | Number of &nu&mu Events |
| Bartol | 0.641798 events | 1.16748 events |
| Sarcevic_std | 1.64133 events | 0.462709 events |
| Sarcevic_min | 0.970059 events | 0.269603 events |
| Sarcevic_max | 2.0843 events | 0.583063 events |
| Naumov_rqpm | 2.60818 events | 1.57047 events |
| Naumov_qgsm | 1.33736 events | 1.07329 events |
| Number of signal events | 1/3(&nue + &nu&mu + &nu&tau) = 62.4838 events |
| Number of background events | CORSIKA + atmoe + atmo&mu = 3.91332 events |
| Number of critical events | 18 events |
| Least detectable signal | 19.7 events |
| Upper limit (&mu90) | 4.78079 events |
| Model rejection factor | 0.0765124 |
| Model discovery factor | 0.315282 |
| Sensitivity flux (E-2) | 2.75445 × 10⁻⁸ GeVsr-1s-1cm-2 |
| Discovery flux (E-2) | 1.13501 × 10⁻⁷ GeVsr-1s-1cm-2 |
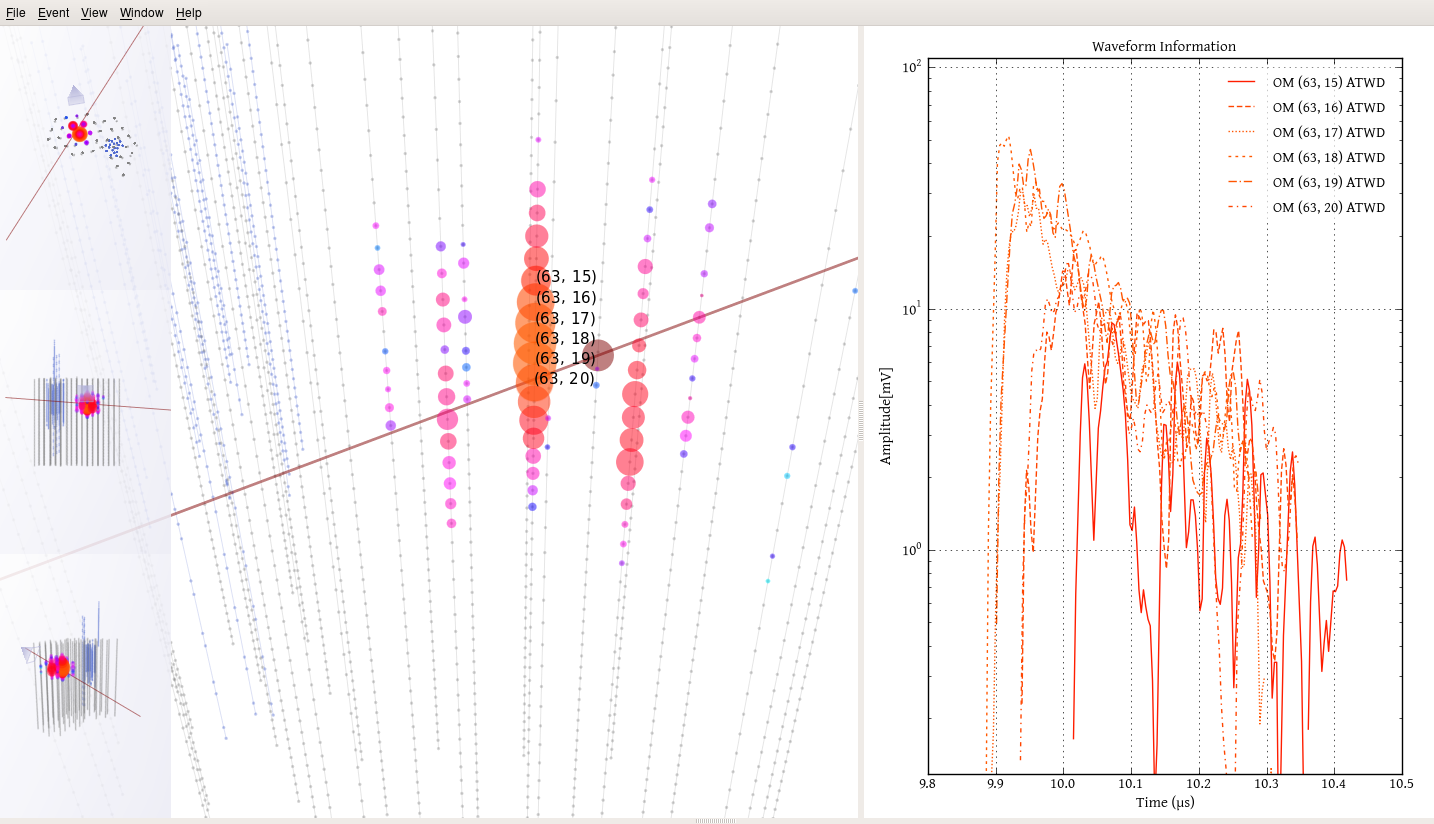 | 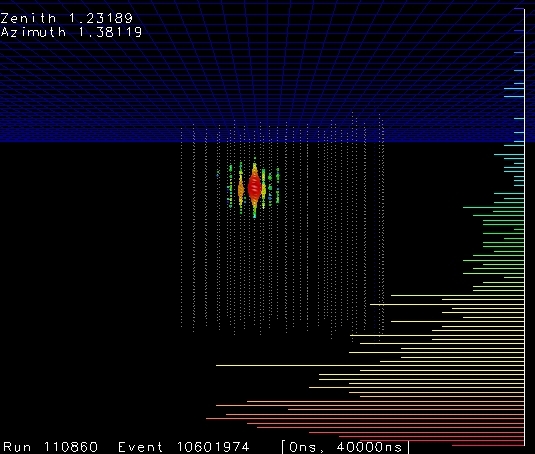 | 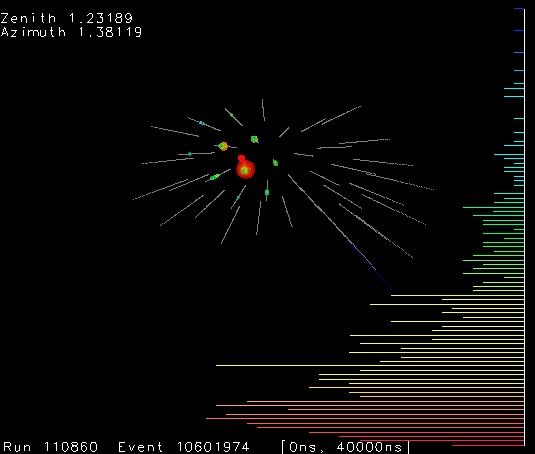 | Event detailsRun: 110860Date: 18th April 2008, 9:56:42 amEnergy: 29.13 TeVBDT response: 0.2675667NCh: 88Zenith: 70.58° Azimuth: 79.14°X vertex: -79.58 metres Y vertex: 322.01 metresZ vertex: 201.82 metres |
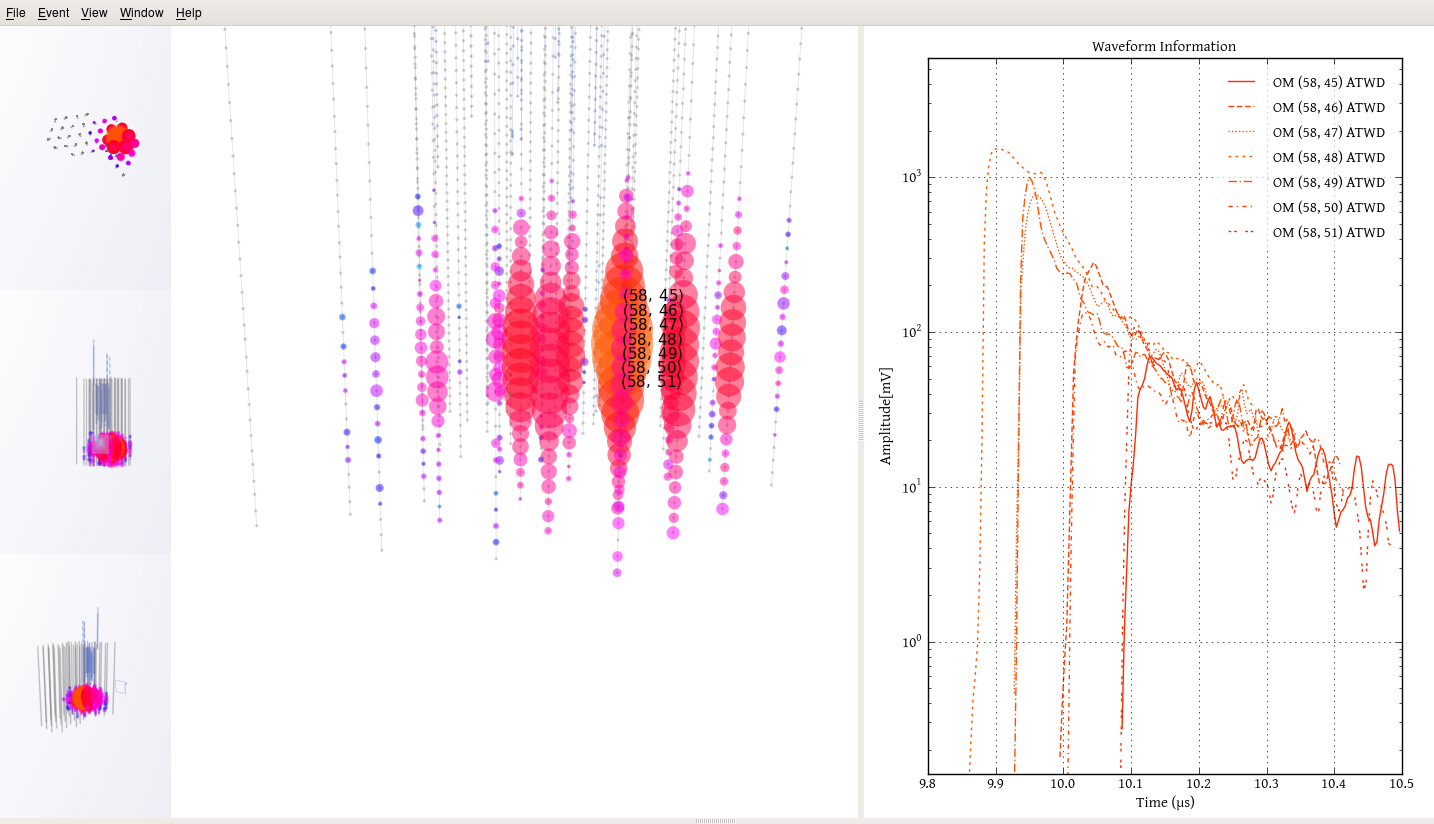 | 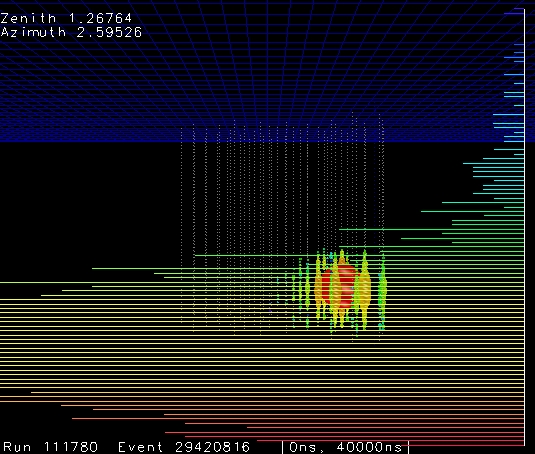 | 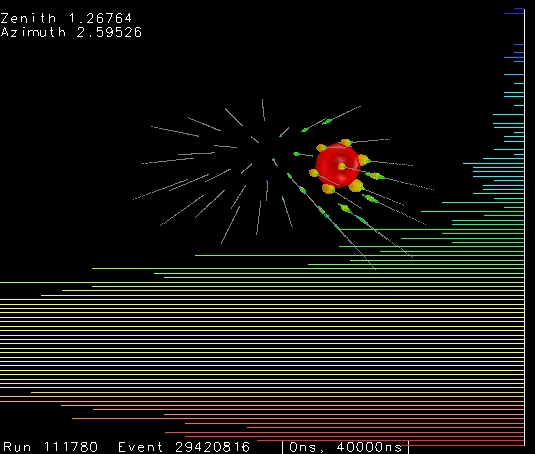 | Event detailsRun: 111780Date: 16th October 2008, 11:32:47amEnergy: 144.20 TeVBDT response: 0.2361462NCh: 359Zenith: 72.63° Azimuth: 148.70°X vertex: 378.63 metres Y vertex: 225.91 metresZ vertex: -303.59 metres |
 |
 |
 |
 |
 |
 |